Unit 6B
Statistics - Cumulative Frequency
1. Answer the whole of this question on a sheet of graph paper.
36 girls were given a test in which the maximum mark available was 100. The table below shows the cumulative frequency of the results obtained.
| Mark | 10 | 20 | 30 | 40 | 50 | 60 | 70 | 80 | 90 | 100 |
| Number of girls scoring this mark or less | 1 | 4 | 8 | 16 | 24 | 29 | 32 | 34 | 35 | 36 |
(a) Calculate how many girls scored a mark between 61 and 70 inclusive.
(b) Using a vertical scale of 2 cm to represent 5 girls and a horizontal scale of 1 cm to represent 10 marks, plot these values on graph paper and draw a smooth curve through your points.
(c) Showing your method clearly, use your graph to estimate the median mark.
(d) State the probability that a girl chosen at random will have a mark
(i) less than or equal to 50,
(ii) greater than 70.
(e) A second group of girls was tested and a quarter of them scored more than 70 marks. If one girl is now chosen at random from each group, find the probability that
(i) both will have scored more than 70,
(ii) just one will have scored more than 70.
2. Answer part (a) on a sheet of graph paper and the rest of the question on the back of the same sheet.
As a test of general knowledge, 200 pupils from a city school had to mark the names of as many streets as they could on a map of the area. The results are given in the following table. For example, 12 pupils named 46 streets correctly, and so on.
| No. of streets correct () | 46 | 47 | 48 | 49 | 50 | 51 | 52 | 53 |
| No. of pupils () | 12 | 25 | 46 | 44 | 30 | 17 | 16 | 10 |
(a) Draw the frequency polygon of this distribution, using the following scales. On the horizontal axis take values of from 46 to 53 and a scale of 2 cm to represent 1 street. On the vertical axis take values of from 0 to 50 and a scale of 2 cm to represent 10 pupils.
(b) For this distribution, find (i) the mode, (ii) the median.
(c) Copy and complete the following table, which uses an assumed mean of 50.
(d) Hence, or otherwise, calculate the mean of the distribution.
| No of streets correct () | No. of pupils () | ||
| 46 | 12 | −4 | −48 |
| 47 | 25 | ||
| 48 | 46 | ||
| 49 | 44 | ||
| 50 | 30 | ||
| 51 | 17 | ||
| 52 | 16 | ||
| 53 | 10 | ||
| Total = 200 | Total = | ||
3. Answer the whole of this question on a sheet of graph paper.
In an athletics event, the distance , in kilometres, run by each of a group of 80 children was recorded. The data obtained was then expressed in two ways as shown in the following tables.
| Distance , in kilometres | ||||||||
| Number of children | 2 | 5 | 11 | 18 | 17 | 8 | 5 |
| Distance , in kilometres | 1 | 2 | 3 | 4 | 5 | 6 | 7 | 8 |
| Number of children running this distance or less | 2 | 7 | 36 | 53 | 67 | 75 | 80 |
(a) Find the values of and .
(b) Using a vertical scale of 2 cm to represent 10 children and a horizontal scale of 2 cm to represent 1 kilometre, draw a smooth cumulative frequency curve to represent the results in the second table.
(c) Showing your method clearly, use your graph to estimate
(i) the median,
(ii) the interquartile range.
(d) Find the probability that one child, chosen at random, has run more than 4 km.
(e) A child is chosen at random from those who have run more than 4 km. Find the probability that the child has run more than 7 km.
(f) Two children are chosen at random from the group of 80 children. Find the probability that neither has run more than 1 km.
4. The graph is a cumulative frequency curve showing the daily travelling expenses of a sample of people employed by a large firm.
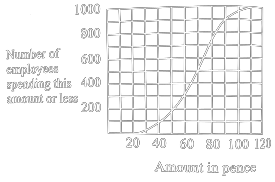
(a) Use the graph to find, as accurately as possible, the median, the interquartile range, the probability that a person chosen at random from the sample spends
(i) or less,
(ii) more than but not more than .
(b) percent of the people in a second sample spend or less on their travelling expenses.
If one person is chosen at random from each sample, calculate the probability that
(i) neither will spend more than ,
(ii) just one will spend more than .
5. Answer the whole of this question on a sheet of graph paper.
The heights of plants, grown under experimental conditions, are given in the following table.
| Height in cm () | |||||||
| No. of plants | 1 | 2 | 4 | 6 | 13 | 22 | 8 |
(a) Copy and complete the following cumulative frequency table.
| Height in cm | 0 | 10 | 20 | 30 | 40 | 50 | 60 | 70 |
| No. of plants of this height or less | 0 | 1 | 56 |
(b) Using a horizontal scale of to represent a height of and a vertical scale of to represent plants, draw a smooth cumulative frequency curve for these results.
(c) Showing your method clearly, use your graph to estimate
(i) the median,
(ii) the interquartile range, of this distribution.
(d) If one plant is selected at random find, as a fraction in its simplest form, the possibility that its height is
(i) greater than ,
(ii) either not greater than or greater than .
(e) The probability that a plant produces a flower is and, whether it does or not, the probability that it suffers from disease is . These probabilities are independent of the height of the plant.
(i) Calculate, as a fraction in its simplest form, the probability that a single plant selected at random produces a flower and does not suffer from disease.
(ii) Given that seven-twelfths of the flowers produced are red, calculate, as a fraction in its simplest form, the probability that a single plant selected at random is of height greater than and produces a red flower.
6. The diagram is the cumulative frequency curve for the marks of candidates in an examination. Use the curve to estimate, as accurately as possible,
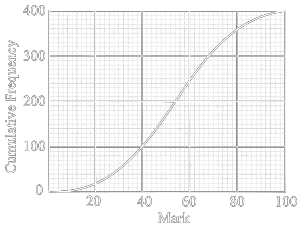
(a) the median mark,
(b) the interquartile range,
(c) the pass mark, given that of the candidates passed the examination,
(d) the probability that a candidate scored or less.
7. A group of young children was tested to find the distance that each of them was able to swim. The results of the test are shown on the cumulative frequency curve below. Using the given curve, find for this distribution,
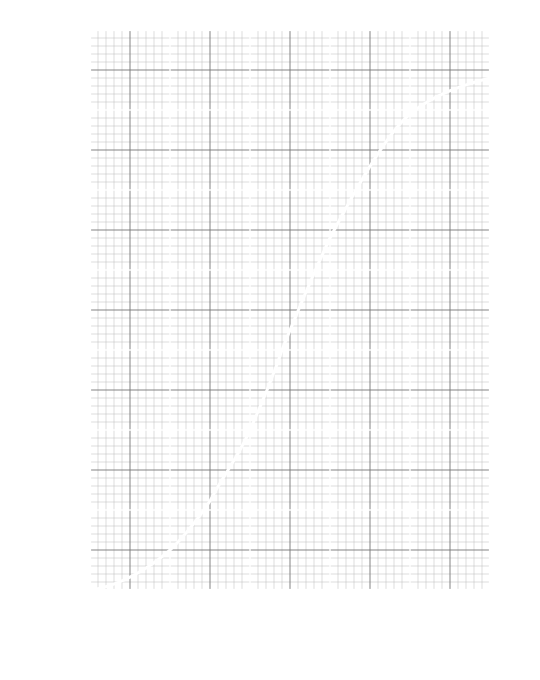
(a) the median,
(b) the interquartile range.
8. Answer the whole of this question on a sheet of graph paper.
The table below gives the distribution of the weights, in kilograms, of the members of a sports club.
| Weight in kilograms | ||||||||
| Number of members | 0 | 3 | 6 | 11 | 24 | 10 | 4 | 2 |
(a) Copy and complete the following cumulative frequency table.
| Weight in kilograms | 40 | 50 | 60 | 70 | 80 | 90 | 100 | 110 |
| Number of members of this weight or less | 0 | 3 | 9 |
(b) Using a horizontal scale of to represent a weight of and a vertical scale of to represent members, draw a cumulative frequency curve for these results over the range .
(i) the median weight,
(ii) the interquartile range.
(d) One member is chosen at random from the . Using your graph, estimate the probability that his weight is less than or equal to .
(e) Ten of the members are swimmers and the other fifty are athletes.
(i) Two members are chosen at random from the . Find the probability that one will be a swimmer and one an athlete.
(ii) One member is chosen at random from the . Estimate the probability that he will be a swimmer and will weigh more than .
[You may assume that there is no connection between the weight of a member and his sporting activity.]
9.Answer the whole of this question on a sheet of graph paper.
A group of elderly people live in a nursing home. Their ages are distributed as shown in the cumulative frequency table below.
| Age in years | ||||||
| No. of people | 0 | 21 | 38 | 62 | 74 | 81 |
(a) Using a horizontal scale of to represent years and a vertical scale of to represent people, draw a cumulative frequency curve to illustrate this distribution.
(b) Use your curve to estimate the median age of the group, showing your method clearly.
(c) Use your curve to estimate the probability that one person selected at random from the group is at least years old.
(d) Find the probability that, if two people are selected at random from the group, they are both less than years old.
(e)
| Age in years () | |||||
| No. of people | 21 | 17 |
This table gives the same information in a different form. Find the value of , the value of and the value of .
(f) This information was illustrated on a histogram and the height of the column representing was . Calculate the height of the column representing .
10. The marks scored by candidates in an examination are shown in the cumulative frequency curve.
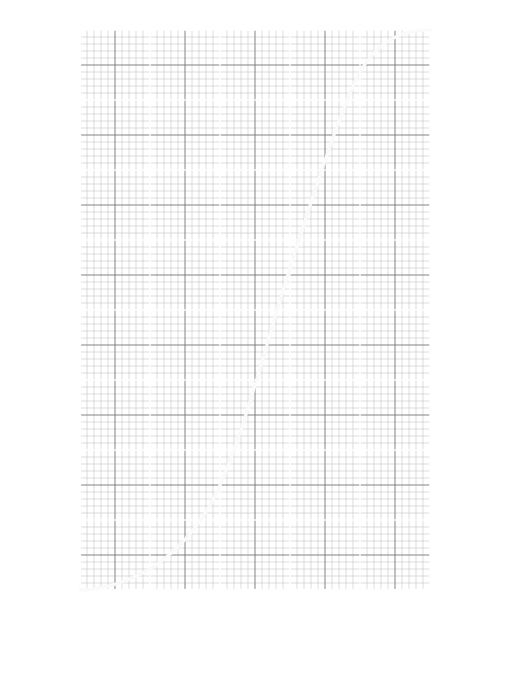
(a) Using the curve, find, for this distribution,
(i) the number of candidates who scored or less,
(ii) the median mark,
(iii) the interquartile range.
(b) Given that candidates passed the examination, find the pass mark.
11. Answer the whole of this question on a sheet of graph paper.
The weights of girls are given in the following table.
| Weight in kg | ||||
| Number of girls | 10 | 30 | 80 | 140 |
| Weight in kg | ||||
| Number of girls | 210 | 200 | 70 | 20 |
(a) Copy and complete the following cumulative frequency table.
| Weight in kg | 46 | 47 | 48 | 49 | 50 | 51 | 52 | 53 | 54 |
| Number of girls of this weight or less | 0 | 10 | 760 |
(b) Draw a smooth cumulative frequency curve for these results, using the following scales. On the horizontal axis take values of the weight from 46 kg to 54 kg and a scale of 2 cm to represent 1 kg. On the vertical axis take values of the cumulative frequency from 0 to 800 and a scale of 2 cm to represent 100 girls.
(c) Showing your method clearly, use your graph to estimate
(i) the number of girls whose weight is less than or equal to 52·5 kg,
(ii) the upper quartile of the distribution,
(iii) the percentage of girls whose weight is greater than 48·5 kg.
(d) If one girl is chosen at random from the group, calculate, as a fraction in its simplest form, the probability that her weight is less than or equal to 48 kg.
(e) If two girls are chosen at random from the group, calculate, as a fraction in its lowest terms, the probability that the weight of each girl is greater than 53 kg.
12. The graph is the cumulative frequency curve showing the age of 300 elderly people. For example, there are 20 people whose age is less than 75. Use the graph to estimate
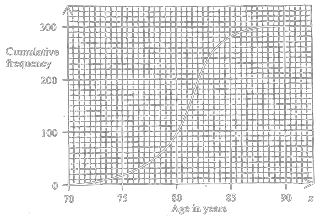
(a) the median age,
(b) the upper quartile and the interquartile range of the distribution,
(c) the number of people who are at least 84 years of age,
(d) the values of , and in the table below.
| Age in years | |||||
| Number of people | 0 | 20 |
13. The weights of 520 applicants for the Army are shown in the cumulative frequency curve below.
(a) Using the curve, estimate for this group of applicants,
(i) the median weight,
(ii) the interquartile range.
(b) Applicants are rejected if their weight is less than 60 kg or more than 85 kg. Estimate what fraction of the 520 applicants is rejected because of their weight.

14. Answer the whole of this question on a sheet of graph paper.
Each of the 560 pupils in a girls' school was asked how far she travelled from home. The results are given in Table 1.
| Distance km | |||||||
| Number of girls | 8 | 34 | 118 | 244 | 106 | 40 | 10 |
(a) Copy and complete the following cumulative frequency table.
| Distance in km | 0 | 1 | 2 | 3 | 4 | 5 | 6 | 7 |
| Number of girls travelling this distance or less | 0 | 8 | 560 |
(b) Using a horizontal scale of 2 cm to represent 1 km and a vertical scale of 2 cm to represent 100 girls, draw a smooth cumulative frequency curve for these results.
(c) Use your graph to estimate the number of girls who travel 4·5 km or more.
(d) Showing your method clearly, use your graph to estimate
(i) the median,
(ii) the interquartile range of this distribution.
(e) One girl is selected at random from the 560.
(i) Find the probability that the distance she travels is less than or equal to 3 km.
(ii) If, instead, the probability that she travels more than kilometres is , find .
(f) Two girls are selected at random from the 560. Find the probability that they each travel a distance less than or equal to 1 km.
15. Answer the whole of this question on graph paper.
The following table gives the frequency distribution of marks obtained by 80 candidates in examinations in Mathematics and English.
| Mark | |||||
| Mathematics | 8 | 12 | 18 | 25 | 17 |
| English | 2 | 10 | 33 | 31 | 4 |
(a) Copy and complete the following table showing the cumulative frequency distribution in each subject.
| Mark | Number of candidates with this mark or less | |
|---|---|---|
| Mathematics | English | |
| 20 | 8 | |
| 40 | 20 | |
| 60 | ||
| 80 | ||
| 100 | 80 | |
(b) Using a scale of 2 cm to represent 20 marks on the horizontal axis and 2 cm to represent 20 candidates on the vertical axis, draw separate cumulative frequency diagrams of the subjects Mathematics and English. Showing your method clearly use your graphs to estimate
(i) the median mark in Mathematics,
(ii) the interquartile range in English,
(iii) the number of candidates who will obtain a distinction in English, if the minimum mark for a distinction is 76,
(iv) how many more candidates will fail to achieve a credit in Mathematics than in English if the minimum mark for a credit is 60 in each subject.
16. An observer notes the speeds of 520 cars as they pass a certain point. The cumulative frequency curve below shows the speed, km/h, and the number of cars whose speed is less than or equal to km/h.
[For example 390 cars have a speed of less than or equal to 45 km/h].

Use the curve to estimate
(a) the number of cars whose speed is less than or equal to 30 km/h,
(b) the median speed,
(c) the interquartile range,
(d) the fraction of the total number of cars whose speed is more than 50 km/h.
17. Answer the whole of this question on a sheet of graph paper.
A cross-country race with 180 runners took place. At certain times after the start, one of the officials made a note of the number of runners who had finished the race. The official's results are given in the table below.
| Time (in minutes) | 35 | 40 | 45 | 50 | 55 | 60 | 65 |
| Number of runners | 0 | 16 | 40 | 84 | 140 | 172 | 180 |
(a) Draw a smooth cumulative frequency curve for these results, using the following scales.
On the horizontal axis take values of the time from 35 minutes to 65 minutes and a scale of 2 cm to represent 5 minutes.
On the vertical axis take values of the cumulative frequency from 0 to 180 and a scale of 2 cm to represent 20 runners.
(b) Showing your methods clearly, use your curve to estimate
(i) the median time taken to run the race,
(ii) the interquartile range of the distribution,
(iii) the number of runners who took 53 minutes, or longer, to finish the race.
(c) The following frequency table relates to the same results.
| Time ( minutes) | ||||||
| Frequency | 16 | 44 | 56 | 8 |
(i) Find the value of and the value of .
(ii) Showing your method clearly, calculate an estimate of the mean time required to run the race.
18. Answer the whole of this question on a sheet of graph paper.
The height of each of the 500 pupils at a school was measured. The results are shown in the following table.
| Height ( cm) | |||||||
| Number of pupils | 10 | 50 | 120 | 90 | 80 | 110 | 40 |
(a) Copy and complete the cumulative frequency table below.
| Height ( cm) | 120 | 130 | 140 | 150 | 155 | 160 | 170 | 190 |
| Number of pupils whose height is less than or equal to . | 0 | 10 | 500 |
(b) Using a horizontal scale of 2 cm to represent a height of 10 cm, for values between 120 cm and 190 cm, and a vertical scale of 2 cm to represent 50 pupils, draw a smooth cumulative frequency curve to illustrate this information.
(c) Showing your method clearly, use your graph to estimate
(i) the median height,
(ii) the lower quartile height,
(iii) the interquartile range.
(d) (i) Use your graph to estimate the number of pupils whose height lies between 145 cm and 165 cm.
(ii) One pupil is selected at random from the school. Find the probability that the pupil's height does not lie between 145 cm and 165 cm.
(e) Two pupils are chosen at random from the school. Find the probability that one has a height less than or equal to 130 cm and the other has a height greater than 170 cm, showing your method clearly.
19. Answer the whole of this question on a sheet of graph paper.
500 plants were grown under experimental conditions. Their heights were distributed as shown in the cumulative frequency table below.
| Height in cm | 10 | 20 | 30 | 40 | 50 | 60 | 70 |
| Number of plants of this height or less | 29 | 75 | 148 | 270 | 395 | 458 | 500 |
(a) Using a horizontal scale of 2 cm to represent a height of 10 cm and a vertical scale of 2 cm to represent 50 plants, draw a cumulative frequency curve for this distribution.
(b) Showing your method clearly, use your curve to estimate
(i) the median of the distribution,
(ii) the upper quartile of the distribution,
(iii) the number of plants with heights greater than 55 cm,
(iv) the percentage of plants with heights 25 cm or less.
(c) The table below gives the same information in a different form.
| Height in cm | |||||||
| Number of plants | 29 | 122 | 125 |
(i) Find the values of , , and .
(ii) Which is the modal class of the distribution?
20. Answer the whole of this question on a sheet of graph paper.
The heights of 660 girls are distributed as shown in the cumulative frequency table below.
| Heights in cm | |||||||||
| No. of girls | 0 | 11 | 42 | 120 | 254 | 427 | 571 | 646 | 660 |
(a) Draw a smooth cumulative frequency curve for these results, using the following scales.
On the horizontal axis take values of the height from 140 cm to 180 cm and a scale of 2 cm to represent a height of 5 cm.
On the vertical axis take values of the cumulative frequency from 0 to 700 and a scale of 2 cm to represent 100 girls.
(b) Showing your method clearly, use your graph to estimate
(i) the number of girls whose height is less than or equal to 152 cm,
(ii) the median of the distribution,
(iii) the value above which the heights of the tallest 20% of the girls lie.
(c)
| Height in cm | ||||||
| No. of girls | 42 | 78 | 173 | 144 | 89 |
This table gives the information in a different form.
Find the value of .
21. The graph is the cumulative frequency curve showing the heights of a sample of 160 children from a school.

(a) Use the graph to find an estimate for
(i) the number of children whose height is more than 150 cm,
(ii) the median height.
(b) The shortest 25% of the children are classed as "short".
The tallest 25% of the children are classed as "tall".
The remaining children are classed as "medium".
Find an estimate for
(i) the greatest possible difference in height between two children classed as "tall",
(ii) the least possible difference between the height of a child classed as "short" and the height of a child classed as "tall".
22. Answer this part of the question on a sheet of graph paper.
A film was watched by 300 people. The following table shows the numbers of people who had left the cinema by certain times after the end of the film.
| Time in minutes | 2 | 5 | 7.5 | 10 | 15 | 20 | 25 |
| Number of people | 50 | 175 | 225 | 250 | 280 | 293 | 300 |
(a) Using a horizontal scale of 2 cm to represent 5 minutes and a vertical scale of 2 cm to represent 50 people, plot the pairs of values in the table and draw a smooth curve through your points.
(b) Showing your method clearly, use your curve to estimate
(i) the time by which 200 people had left the cinema,
(ii) the number of people who took more than 12 minutes to leave,
(iii) the median time taken to leave.
23. Answer the whole of this question on a sheet of graph paper.
The numbers of pupils in 720 schools are given in the following table.
| Number of pupils () | ||||||
| Number of schools | 65 | 84 | 139 | 254 | 142 | 36 |
(a) Copy and complete the following cumulative frequency table.
| Number of pupils () | ||||||
| Number of schools | 65 | 542 | 720 |
(b) Using a horizontal scale of 2 cm to represent 100 pupils and a vertical scale of 2 cm to represent 100 schools, draw a smooth cumulative frequency curve for this distribution.
(c) Showing your method clearly, use your graph to estimate
(i) the number of schools with 220 pupils or fewer,
(ii) the median of the distribution,
(iii) the percentage of schools with more than 450 pupils.
(d) If one of the 720 schools is chosen at random, calculate, as a fraction in its simplest form, the probability that it has 300 pupils or fewer.
(e) If two of the 720 schools are chosen at random, calculate, as a fraction in its simplest form, the probability that both schools have more than 500 pupils each.
24. Answer the whole of this question on a sheet of graph paper.
One thousand candidates took a Mathematics examination which consisted of two papers. Each paper was marked out of 50. Table A gives the distribution of marks and Table B is the corresponding cumulative frequency table.
| Mark () | Number of candidates | |
|---|---|---|
| Paper 1 | Paper 2 | |
| 200 | ||
| 340 | ||
| 295 | ||
| 125 | ||
| 180 | 40 | |
| Mark | Number of candidates with this mark or less | |
|---|---|---|
| Paper 1 | Paper 2 | |
| 10 | 55 | |
| 20 | 180 | |
| 30 | 400 | |
| 40 | 820 | |
| 50 | 1000 | 1000 |
(a) By comparing the two tables, calculate the values of , , , and , , , .
(b) Using a horizontal scale of 2 cm to represent 10 marks, and a vertical scale of 2 cm to represent 100 candidates, draw the cumulative frequency curve for Paper 1.
(c) Use your curve to estimate, for paper 1,
(i) the median mark,
(ii) the interquartile range,
(iii) the 30th percentile.
(d) The pass mark for Paper 1 was 21. Use your graph to estimate the number of candidates who passed.
(e) The top 12% of the candidates taking Paper 1 gained a Distinction. Use your graph to estimate the minimum mark required for a Distinction.
(f) On the same diagram, using the same axes, draw the cumulative frequency curve for paper 2.
(g) A further candidate gained a mark of 40 on Paper 1, but was absent for Paper 2. Use your two graphs to estimate the mark which he might have been expected to gain on Paper 2.
25. Answer the whole of this question on a sheet of graph paper.
The Port Louis bus is due to arrive at a bus station at 09 30 each day. Its actual time of arrival was recorded over a period of 100 days and the results are shown in the following table.
| Time () | ||||||
| No. of days | 2 | 13 | 20 | 32 | 27 | 6 |
(a) Elizabeth reaches the station at exactly 09 20 every morning to catch the Port Louis bus. Calculate an estimate of the mean number of minutes that she has to wait before the bus arrives on these 100 days. Give your answer correct to the nearest tenth of a minute.
(b) Copy and complete the cumulative frequency table for the time of arrival.
| Time by which bus arrives | 09 24 | 09 26 | 09 28 | 09 30 | 09 32 | 09 34 | 09 36 |
| Number of days | 0 | 2 | 15 |
(c) Using a horizontal scale of 2 cm to represent 2 minutes for times between 09 24 and 09 36, and a vertical scale of 2 cm to represent 20 days, draw a cumulative frequency diagram to illustrate this information.
(d) Use your diagram to find
(i) the median time of arrival,
(ii) the interquartile range, giving your answer correct to the nearest tenth of a minute.
(d) John arrives at the bus station each day on the Port Louis bus and wants to catch another bus that is due to leave the bus station at 09 35. It takes him exactly 2 minutes to go from one bus to the other. The second bus always leaves at exactly 09 35.
Use your diagram to estimate the probability that he caught the second bus on a particular day.
26. A long ruler was fastened to a wall and used to measure the heights of 120 children. The diagram shows the cumulative frequency graph of these heights.

(a) Use the graph to estimate
(i) the median,
(ii) the interquartile range,
(iii) the number of children whose height is greater than 170 cm.
(b) Several days later it was noticed that the ruler had been wrongly positioned, and that all heights should be 3 cm less. State what adjustment, if any, should be made to your results for parts (a) (i) and (a) (ii) in order to give the correct value of
(i) the median,
(ii) the interquartile range.
27. Answer the whole of this question on a sheet of graph paper.
160 electric light bulbs of brand A were tested to find the life of each bulb (that is the time it lasted before it failed). The results are given in the table below.
| Life ( hours) | |||||
| Number of bulbs | 2 | 4 | 13 | 68 | 51 |
| \(2500 < t \le 3000\) | |||||
| 18 | 3 | 1 | |||
(a) Copy and complete the following cumulative frequency table.
| Life in hours | ||||||||
| Number of bulbs | 2 | 6 | 160 |
(b) Using a horizontal scale of 2 cm to represent 500 hours and a vertical scale of 2 cm to represent 20 bulbs, draw a smooth cumulative frequency curve for these results.
(c) Showing your method clearly, use your graph to estimate
(i) the median,
(ii) the 10th percentile of the distribution.
160 brand bulbs were also tested and a report on the test gave the following information.
4 bulbs had a life hours.
None lasted beyond 3200 hours.
The median life was 2300 hours.
The upper quartile of the distribution was 2600 hours.
The interquartile range of the distribution was 600 hours.
(d) Use this information to draw, on the same axes, a smooth cumulative frequency curve for the brand bulbs.
(e) Use your graphs to estimate the number of bulbs with a life 2750 hours or less
(i) for brand ,
(ii) for brand .
(f) Both brands are the same price. Which do you think is the better buy? Give a reason for your choice.
28. A sentence in a book has 20 words in it. The number of letters in each word is counted and the table below shows the frequency distribution.
| Number of letters | 2 | 3 | 4 | 5 | 6 | 7 |
| Frequency | 1 | 4 | 5 | 3 | 5 | 2 |
[For example, 1 word has 2 letters, 4 words have 3 letters.]
(a) A word is chosen at random from the whole sentence. What is the probability that it has 4 letters?
(b) A word is chosen at random from those with an odd number of letters. What is the probability that it has 7 letters?
(c) One person chooses a word at random from the whole sentence. Another person then chooses a word at random from the whole sentence. What is the probability that one person chooses a two-letter word and the other chooses a six-letter word?
29. Answer the whole of this question on a sheet of graph paper.
The population of a small island, , is 3000. The histogram shows the distribution of ages of the population.

(a) Find the values of and in the frequency table below.
| Age ( years) | |||||||
| Frequency | 150 | 250 | 400 | 450 | 950 |
(b) Copy and complete the cumulative frequency table below.
| Age in years | |||||||
| Cumulative frequency | 150 | 400 | 3000 |
(c) Using a horizontal scale of 2 cm to represent 10 years and a vertical scale of 2 cm to represent 500 people, draw a smooth cumulative frequency curve to illustrate this information.
(d) Use your graph to estimate
(i) the median age of the population,
(ii) the number of people who are more than 57 years old.
(e) A second island, , also has a population of 3000. For this population the median age is 23, the lower quartile is 15, the interquartile range is 20 and the age of the oldest inhabitant is 70.
On the axes you used for part (c), draw the cumulative frequency curve to illustrate this information.
(f) Which island is likely to have the greater population in 10 years' time? Explain your answer.
30. Answer the whole of this question on a sheet of graph paper.
The length of time taken by all of the 600 pupils of a school to complete a task is given in the table below.
| Time ( minutes) | ||||||
| Number of pupils | 70 | 170 | 210 | 95 | 35 | 20 |
(a) Calculate an estimate of the mean time taken to complete the task.
(b) Copy and complete the cumulative frequency table for the time taken to complete the task.
| Time in minutes | |||||||
| Number of pupils | 0 | 70 | 600 |
(c) Using a horizontal scale of 2 cm to represent 10 minutes for times between 30 minutes and 100 minutes, and a vertical scale of 2 cm to represent 100 pupils, draw a cumulative frequency curve to illustrate this information.
(d) Use your graph to find
(i) the median time taken,
(ii) the interquartile range,
(iii) the 70th percentile,
(iv) the probability that a pupil chosen at random from the school took more than 60 minutes.
31. Answer the whole of this question on a sheet of graph paper.
The lengths of 200 leaves were measured. The cumulative frequencies are given in the table below.
| Length ( mm) | ||||||
| Cumulative frequency | 0 | 15 | 60 | 130 | 180 | 200 |
(a) Using a horizontal scale of 2 cm to represent 10 mm, and a vertical scale of 2 cm to represent 50 leaves, draw a cumulative frequency curve to illustrate this information.
(b) Showing your method clearly, use your graph to estimate
(i) the median,
(ii) the interquartile range,
(iii) the number of leaves which are longer than 55 mm.
(c) The frequency distribution for these results is given in the table below.
| Length ( mm) | |||||
| Frequency | 15 | 45 | 50 |
(i) Write down the value of and the value of .
(ii) Draw a histogram to illustrate this information. Use a horizontal scale of 2 cm to represent 10 mm. Use a vertical scale for frequency density such that the height of the first column is 3 cm.
32. Six hundred candidates took a Mathematics examination which consisted of two papers. Each paper was marked out of 100. The diagram shows, on the same axes, the cumulative frequency curves for Paper 1 and Paper 2.

(a) Use the graph for Paper 1 to estimate
(i) the median,
(ii) the interquartile range,
(iii) the number of candidates who scored more than 45 marks.
(b) A candidate scored 60 on Paper 1. Use the two graphs to estimate this candidate's mark on Paper 2.
(c) State, with a reason, which you think was the more difficult paper.
33. 160 candidates took an examination.
The mark distribution produced the following information:
the median mark was 39,
the inter-quartile range was 23 marks,
the lower quartile was 27 marks,
the highest mark scored was 68,
the lowest mark scored was 6.
(a) Calculate the upper quartile of this distribution.
(b) On the axes in the answer space, draw the cumulative frequency curve to represent this information.

34. Answer the whole of this question on a sheet of graph paper.
One day a farmer collected 340 eggs from his chickens. The table below shows the distribution of the masses of the eggs.
| Mass ( grams) | |||||||
| Frequency | 40 | 60 | 40 | 48 | 72 | 56 | 24 |
(a) When a histogram is drawn to illustrate this information, the rectangle representing the eggs with masses in the interval has width 2 cm and height 3 cm. Find the width and the height of the rectangle representing the eggs with masses in the interval .
(b) Copy and complete the cumulative frequency table below.
| Mass in grams | ||||||||
| Cumulative frequency | 0 | 40 | 100 | 340 |
(c) Using a scale of 2 cm to represent 5 grams, draw a horizontal -axis for .
Using a scale of 2 cm to represent 50 eggs, draw a vertical axis for values from 0 to 340.
On your axes, draw a smooth cumulative frequency curve to illustrate this information.
(d) Use your graph to find
(i) the median mass of the eggs,
(ii) the interquartile range.
(e) The farmer classifies 60 of the eggs to be "Large Eggs" and 80 of the eggs to be "Small Eggs".
(i) Use your graph to find the least mass of a "Large Egg".
(ii) An egg is chosen at random. Another egg is then chosen at random from those that remain. Calculate the probability that one is "Small" and the other is "Large".
35. The diagram shows the cumulative frequency graph of the marks scored by 160 students in an examination.

(a) Use the graph to estimate
(i) the median mark,
(ii) the interquartile range,
(iii) the number of students who scored 70 marks or more.
(b) Before combining these marks with those of another exam, the teacher scaled them. To obtain the scaled mark, the teacher multiplied each student's mark by 2 and then subtracted 20 from the result.
Write down
(i) the median scaled mark,
(ii) the interquartile range of the scaled marks,
(iii) the number of students who had a scaled mark of 80 or more.
36. The graph is a cumulative frequency curve showing the marks gained by 300 candidates in an examination.
(a) Use the curve to estimate
(i) the median mark,
(ii) the number of candidates who gained 33 marks or less.
(b) It is given that 70 candidates achieved a grade A.
Use the curve to estimate the smallest mark required for a grade A.
37. The graph is a cumulative frequency curve showing the time taken by 300 students to solve a problem.
Use the curve to estimate
(a) the median time,
(b) the number of students who took at least 2.7 minutes to solve the problem,
(c) the time taken for the fastest 40 students to solve the problem.